Network Monitoring With Raspberry Pi
I’ve had a LOT of issues, over the last few years, with my Internet service. One of the most annoying things (of the many annoying things) in dealing with Internet service providers (cough Xfinity cough), is convincing them that, yes, there is actually a problem. Recently we had an issue where our internet would go out for up to 10 minutes at a time randomly, often several times a day. Because it’s random, when we got the service person out to look at it, it, of course, worked perfectly while he was here.
So, I set up a network monitoring system using two Raspberry Pis, collectd, prometheus and grafana. I used two Raspberry Pi 4s that I had lying around, one for the data collection (collectd) and publishing (prometheus), and the other for the display (grafana). I probably could have just used one, but I wanted to make sure that I didn’t overburden it with both tasks.
Setup
OS
I installed Raspberry Pi OS on both, because it works well and because I’m familiar with Debian, which we use at work. My general method for setting it up is:
- Use the Raspberry Pi Imager to install the OS on an SD card, then boot the pi with the SD card
- I’m lazy, so instead of plugging my keyboard and monitor into the card, I look for a new pi on the network, and SSH in using the default username and password
- Once logged into the pi, I do the following:
- Add myself as a user and disable the default user
- Set the hostname
- Install Avahi and get it running
- Restart the pi
From there, the pi should be on my network as <hostname>.local - I set the hostname of one of them, the one that will host collectd and prometheus as “prometheus”, and the other to be “grafana”.
Collectd
Collectd configuration is pretty straightforward. I took the default collectd.conf file in /etc/collectd/collectd.conf, set the Hostname config value to prometheus, uncommented the lines for the syslog plugin (so I can get logs to tell me what’s going on), and configured the ping plugin like so:
<Plugin ping>
        Host "www.google.com"
        Interval 1.0
        Timeout 0.9
        TTL 255
        SourceAddress "192.168.0.163"
        Device "wlan0"
        MaxMissed -1
</Plugin>
This records the ping times and drop rate of pings to Google (the source address and network device will be different on your setup, obviously). Then, I just did sudo systemctl start collectd.
Prometheus
To configure Prometheus, I simply add a new job to the scrape_configs section of the prometheus.yml file:
- job_name: 'collectd'

    # Override the global default and scrape targets from this job every 5 seconds.
    scrape_interval: 5s
    scrape_timeout: 5s

    # metrics_path defaults to '/metrics'
    # scheme defaults to 'http'.

    static_configs:
      - targets: ['prometheus.local:9103']
That port, 9103, is the port that collectd publishes its data on.
Grafana
The Prometheus website has a good overview on how to configure Grafana to use prometheus as a data source. Configuring the dashboard is fairly straightforward as well.
Result
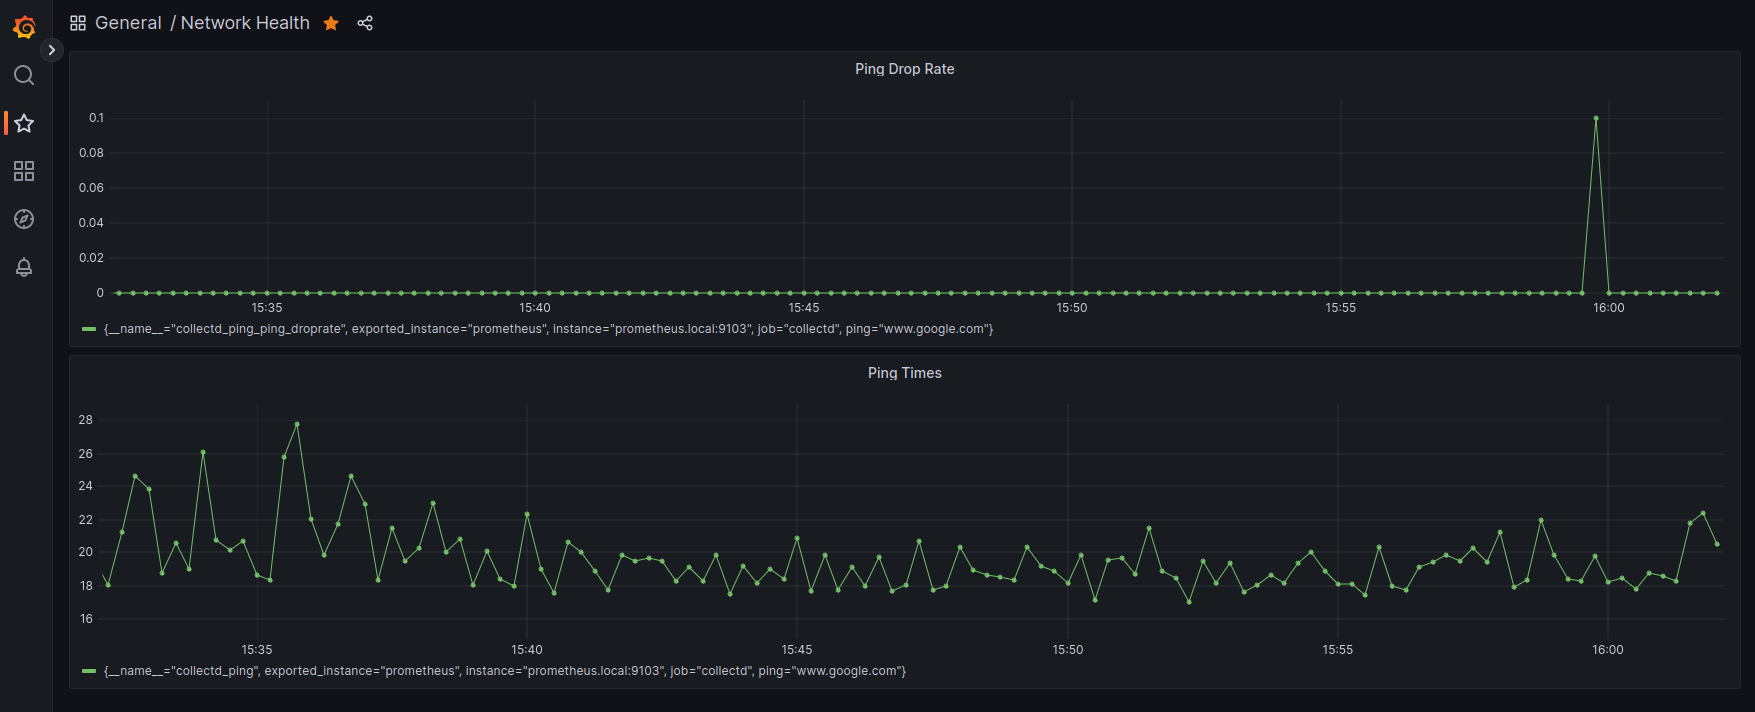
Once that was all done, I had my graphs:
Here’s an example of a network drop-out:
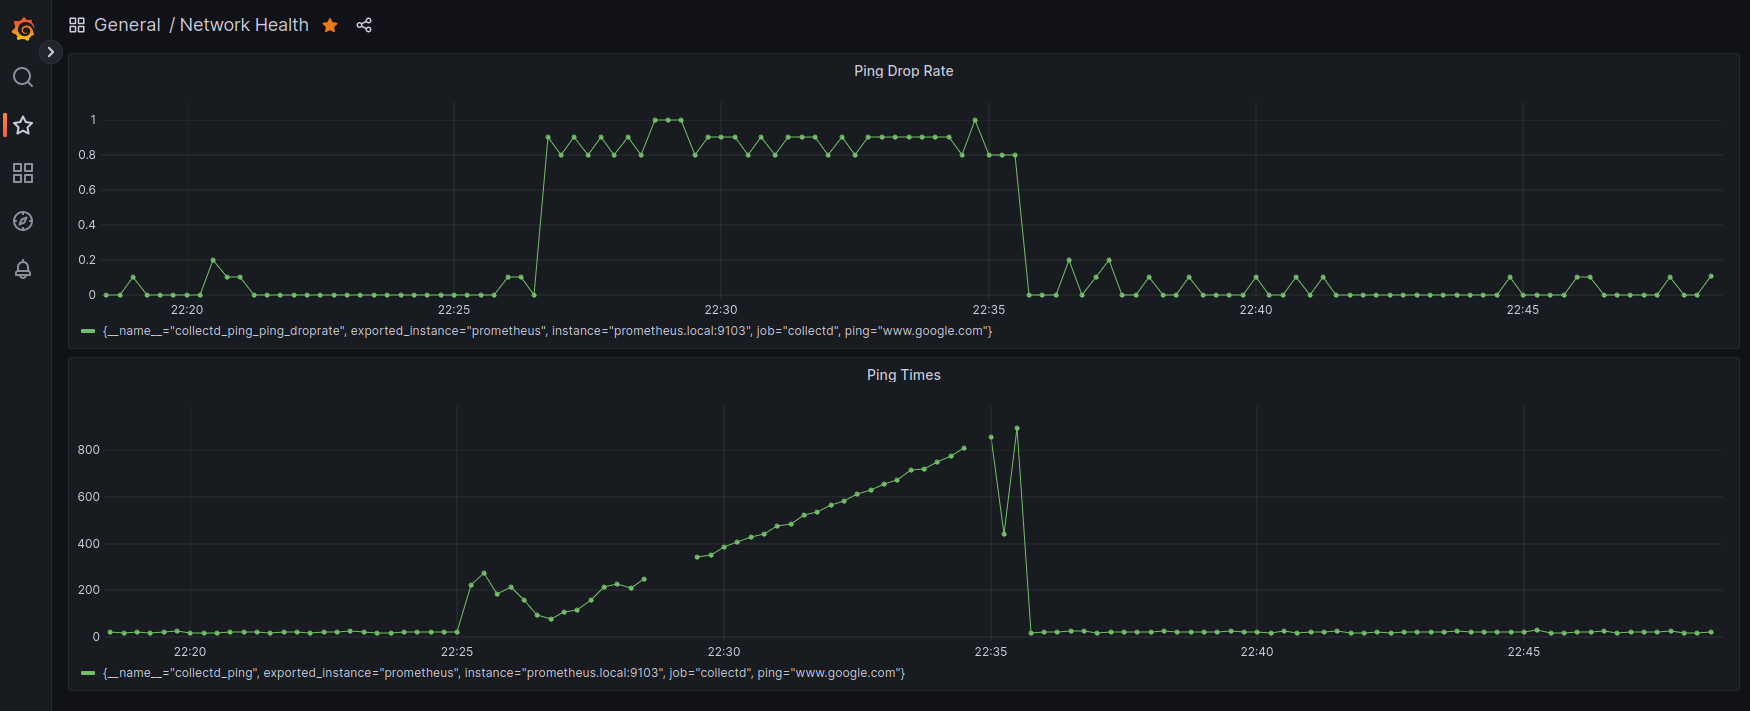
You can see that the ping drop rate hit 1 (100%) for around 10 minutes or so.